Print
Department of Commerce
Published on Department of Commerce (https://2014-2017.commerce.gov)

Home > Are You Dreaming of a White Christmas?

You are here

  1. Home

Are You Dreaming of a White Christmas?

Dec112015

Print this page
Image(s) included
Post a comment
DataEnvironment

Posted at 1:06 PM

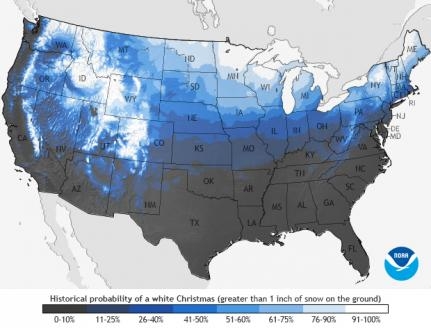
The “Historical Probability of a White Christmas” map shows the climatological probability of at least 1 inch of snow being on the ground on December 25 in the contiguous United States.

For those of you dreaming of a white Christmas, this map depicts which places have the best chance of being a winter wonderland according to weather history. The “Historical Probability of a White Christmas” map shows the climatological probability of at least 1 inch of snow being on the ground on December 25 in the contiguous United States. On the map, dark gray shows places where the probability is less than 10 percent, while white shows probabilities greater than 90 percent.

Where does history say you should be in the lower 48 for the best chance of seeing a white Christmas? Most of Idaho, Minnesota, Maine, Upstate New York, the Allegheny Mountains of Pennsylvania and West Virginia, and, of course, the Rockies and the Sierra Nevada Mountains all have a high probability of seeing a white Christmas. And, Aspen, Colorado, is just one of about a dozen locations boasting a 100% historical probability of seeing a white Christmas.

This map is based on the 1981–2010 Climate Normals, which are the latest three-decade averages of several climatological measurements. This dataset contains daily and monthly Normals of temperature, precipitation, snowfall, heating and cooling degree days, frost/freeze dates, and growing degree days calculated from observations at approximately 9,800 stations operated by NOAA’s National Weather Service. You can find the Climate Normals for locations near you by using NCDC’s interactive map or search tool.

While the map shows the climatological probability of snow-covered ground on December 25, the actual conditions this year may vary widely from these probabilities because the weather patterns present will determine if there is snow on the ground or if snow will fall on Christmas Day. These probabilities are useful as a guide only to show where snow on the ground is more likely. For prediction of your actual weather conditions, check out your local forecast at Weather.gov within seven days of Christmas.

If you would like to keep track of the snowfall across the United States on a daily basis, see the National Operational Hydrologic Remote Sensing Center’s National Snow Analyses.

For a more detailed assessment of the probability of a white Christmas as well as documentation of the methodology used to calculate the map’s underlying climatological statistics, see our scientists’ paper, White Christmas? An Application of NOAA’s 1981-2010 Daily Normals(link is external), published in the Bulletin of the American Metrological Society. And, download our spreadsheet to see the full list of stations and their probabilities.
Organizations and Groups

  • National Oceanic and Atmospheric Administration
  • National Weather Service

Related content

Feb292016

Document(s) attached

Fact Sheet: Overview of the EU-U.S. Privacy Shield Framework

DataTrade and InvestmentDigital EconomyEU-U.S. Privacy Shield
The EU-U.S. Privacy Shield Framework was designed by the U.S. Department of Commerce and European Commission to provide companies on both sides of the Atlantic with a...

Jun202016

U.S. Commerce Department Releases New Report on Foreign Direct Investment Trends

DataTrade and InvestmentForeign Direct Investment (FDI)
The U.S. Department of Commerce today released a new report that highlights the impact of foreign direct investment (FDI) on the U.S. economy. The Foreign Direct Investment...

Mar242016

texas.jpg

U.S. Census Bureau Graphic:  Lone Star State Metro Areas Lead U.S. in Population Gain
Image(s) included
Post a comment

U.S. Census Bureau Releases Population Estimates for Nation's Cities and Counties

DataPopulation Estimates
Four Texas metro areas together added more people last year than any state in the country except for Texas as a whole, according to new U.S. Census Bureau population...
/*Fix video embed transcript line height which was set to 0, squishing transcript to one line.*/ .file.view-mode-embedded_video { line-height: inherit; }

Source URL: https://2014-2017.commerce.gov/news/blog/2015/12/are-you-dreaming-white-christmas

Links:
[1] https://2014-2017.commerce.gov/news/blog/2015/12/are-you-dreaming-white-christmas
[2] https://2014-2017.commerce.gov/node/1726#comment-form-collapsed
[3] https://2014-2017.commerce.gov/categories/data
[4] https://2014-2017.commerce.gov/categories/environment
[5] https://2014-2017.commerce.gov/media/photo/whitechristmasjpg
[6] http://www.ncdc.noaa.gov/data-access/land-based-station-data/land-based-datasets/climate-normals/1981-2010-normals-data
[7] http://gis.ncdc.noaa.gov/map/viewer/#app=cdo&cfg=cdo&theme=normals&layers=01&node=gis&extent=-149.3:20.2:-60.1:69.6&custom=normals
[8] http://www.ncdc.noaa.gov/cdo-web/datatools/normals
[9] http://www.weather.gov/
[10] http://www.nohrsc.noaa.gov/nsa/
[11] http://journals.ametsoc.org/doi/abs/10.1175/BAMS-D-15-00038.1
[12] http://www.ncdc.noaa.gov/sites/default/files/attachments/Christmas_Snow_Statistics.xlsx