Print
Department of Commerce
Published on Department of Commerce (https://2014-2017.commerce.gov)

Home > Quarterly Gross Domestic Product by State, 2005–2013 (Prototype Statistics)

You are here

  1. Home

Quarterly Gross Domestic Product by State, 2005–2013 (Prototype Statistics)

Aug202014

Print this page
Image(s) included
Post a comment
DataGross Domestic Product (GDP)

Posted at 10:27 AM

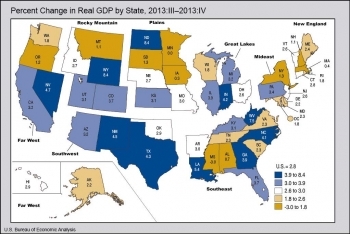
Percent Change in Real GDP by State, 2013:lll-2013:lV

Cross Post: Bureau of Economic Analysis

  • The quarterly GDP by state prototype statistics for 2005-2013 provide a more complete picture of economic growth across states as they evolve from quarter to quarter. 
  • The quarterly GDP by state statistics are released for 21 industry sectors and are released in both current dollars and inflation-adjusted chained (2009) dollars. 
  • Nondurable-goods manufacturing was the largest contributor to U.S. real GDP by state growth in the fourth quarter of 2013. This industry was the leading contributor to real GDP growth in 31 states in the fourth quarter. 
  • Professional, scientific, and technical services was the second largest contributor to U.S. real GDP growth in the third and fourth quarters of 2013. This industry contributed to the growth in 49 states and the District of Columbia in the fourth quarter of 2013. 
  • Wholesale trade contributed to real GDP growth in 48 states and the District of Columbia in the fourth quarter of 2013. 
  • Construction subtracted from real GDP growth in 47 states and the District of Columbia in the fourth quarter of 2013.

Read the full report.

Organizations and Groups

  • Bureau of Economic Analysis
  • Economics and Statistics Administration

Related content

Jan182017

gdpgraphic.png

U.S. Bureau of Economic Analysis (BEA) Graphic on Real GDP: 2012--2016
Image(s) included
Post a comment

Operational Excellence: Accelerating the Census Bureau’s Economic Indicators Improves Accuracy, Timeliness of Commerce Data

DataGross Domestic Product (GDP)
The acceleration of the U.S. Census Bureau’s principal federal economic indicators has been a model of operational excellence for the agency and the U.S. Commerce Department...

Mar162016

consumerspendinggraphic.jpg

Consumer Spending Graphic
Image(s) included
Post a comment

BEA Data Provide a Look into America’s Shopping Carts

DataGross Domestic Product (GDP)Consumer SpendingOpen for Business Agenda
America’s consumers spent more than $12 trillion last year on all kinds of stuff, including new cars, furniture, clothes, groceries, beauty products, electronics, visits to...

Oct262016

Op-Ed: Here's How the U.S. Measures GDP in the Age of Big Data

DataGross Domestic Product (GDP)Big DataAmerica's Data Agency
Simon Kuznets is not a household name. Born to a Jewish family in pre-Soviet Belarus in 1901, Kuznets studied economics in Ukraine until 1922, when Russian persecution led...
/*Fix video embed transcript line height which was set to 0, squishing transcript to one line.*/ .file.view-mode-embedded_video { line-height: inherit; }

Source URL: https://2014-2017.commerce.gov/news/blog/2014/08/quarterly-gross-domestic-product-state-2005-2013-prototype-statistics

Links:
[1] https://2014-2017.commerce.gov/news/blog/2014/08/quarterly-gross-domestic-product-state-2005-2013-prototype-statistics
[2] https://2014-2017.commerce.gov/node/646#comment-form-collapsed
[3] https://2014-2017.commerce.gov/categories/data
[4] https://2014-2017.commerce.gov/tags/gross-domestic-product-gdp
[5] https://2014-2017.commerce.gov/media/photo/qgsp0814faxjpg
[6] http://blog.bea.gov/2014/08/20/quarterly-gross-domestic-product-by-state-2005-2013-prototype-statistics/
[7] http://www.bea.gov/newsreleases/regional/gdp_state/Qgsp_newsrelease.htm