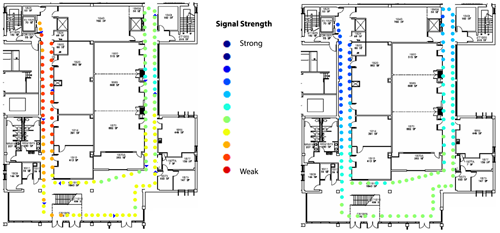
These diagrams illustrate the results of measurements of signal strength along one walk route. On the left are the results of when signals are being transmitted only by the cell tower located two km from the test site. On the right are the results of when transmissions are supplemented by in-building systems. The benefits of supplemental cells are easily seen by comparing the colors between the left and right diagrams with red showing poor coverage and blue showing good coverage.