Aug242015
Posted at 9:47 AM
Guest blog post by Eric Newburger, Senior Scientist for Data Training, Office of the Chief Data Officer
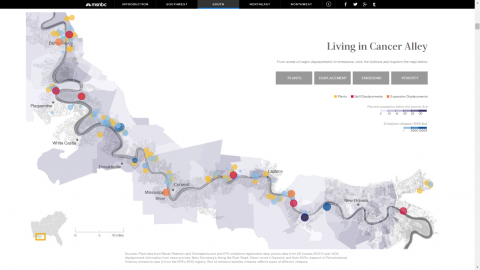
MSNBC has published a data-heavy story collection that takes advantage of the internet’s power to communicate not only faster, but in different and meaningful ways. “The Geography of Poverty” combines narrative, data graphics, and photo-essay content through an interface so seamless as to be almost invisible.
So far they have released three of what will eventually be five parts, but already they have tapped datasets from BLS, Census, the Department of Agriculture, and EPA. They combined these federal sources with private data: factory data from Randy Peterson and Chemplants.com; displacement information from news sources; Mary Sternberg's “Along the River Road”; and Steve Lerner's Diamond and Kate Orff's research in “Petrochemical America.”
These layers of data feed visualizations which provide a deeper understanding of the highly personal stories the photos tell; the text weaves the elements into a cohesive whole. Today’s web tools make this kind of reporting not only possible, but fairly simple to assemble.
The result is a new kind of media that mixes the personal and the societal, the social and the environmental, fitting small scale stories of individuals and local communities into the broader context of our whole nation.
Data like those used in this visualization can be found at:


